
Doview® Visual Strategic Planning communicates faster than text-based strategic planning because ‘a picture is worth a thousand words’. In additon, in a world where you may need to change your strategy overnight, you can quickly adjust a visual strategic plan by just tweeking your priorities directly onto your DoView® visual plan.
Once you have argued through, and built, your consensus visual strategy model, it functions as a concrete visual representation that emodies your collective strategy.
You can then work directly with this visual strategic plan to ensure organizational, KPI and OKR* alignment. This avoids the traditional risk of slippage between peoples’ different mental models of what they think the strategy is and has been captured in traditional text-based strategic plans.
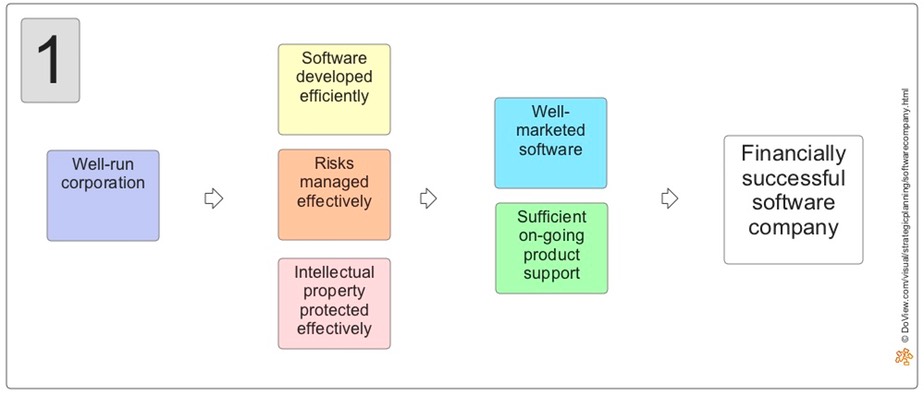
Below is a simple example of a visual strategic plan.
A DoView® visual strategy model of what you’re wanting to do is drawn with the board, executive team or strategic planners
A visual model of the organization’s high-level outcomes and the lower-level steps that are needed to achieve them.
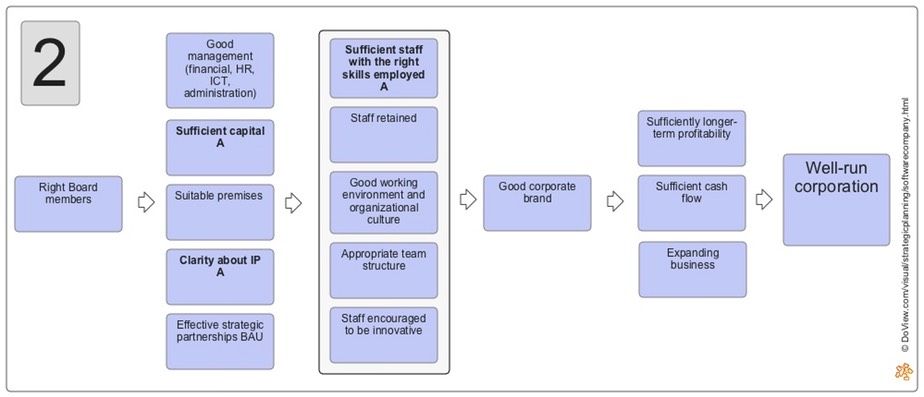
Click on the boxes with small gray triangles to drill-down into this live DoView® visual strategy model below.
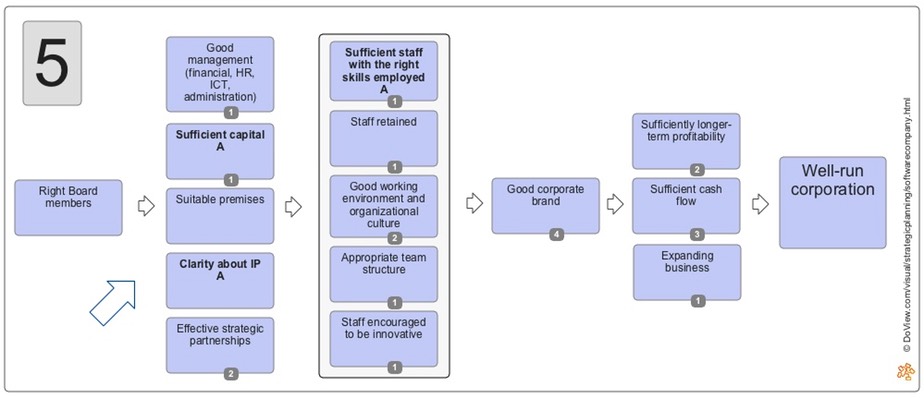
Boxes within the model are prioritised
Show which outcomes you are focusing on in the next planning period (e.g. the next year). Only ‘A' priorities are shown, in a real example ‘B’ and ‘C’ priorities would also be shown.
Project/activities boxes are inserted
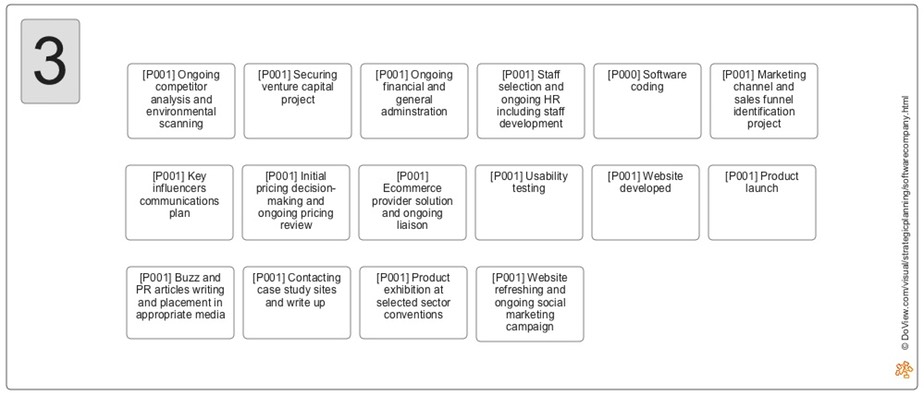
Projects are linked to the priority boxes they are focused on
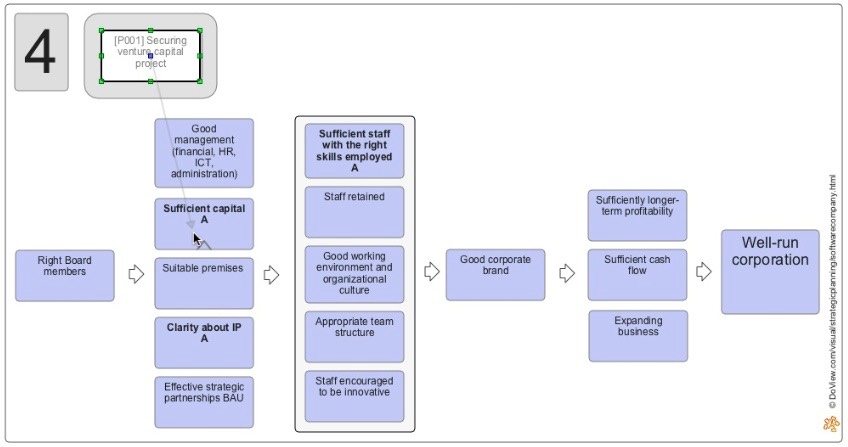
The model is reviewed to make sure that there is ‘line-of-sight’ alignment
Make sure that you’re focusing your activities or projects on your priorities. The number in the gray box shows the number of projects focused on each box. The ‘Clarity about IP’ box in the model below does not have any projects focused on it. Therefore it is either not a priority for the organanization or at least one new project needs to be developed that focuses on it. In real-world visual strategic planning, there are usually many more project boxes than in this simple example.
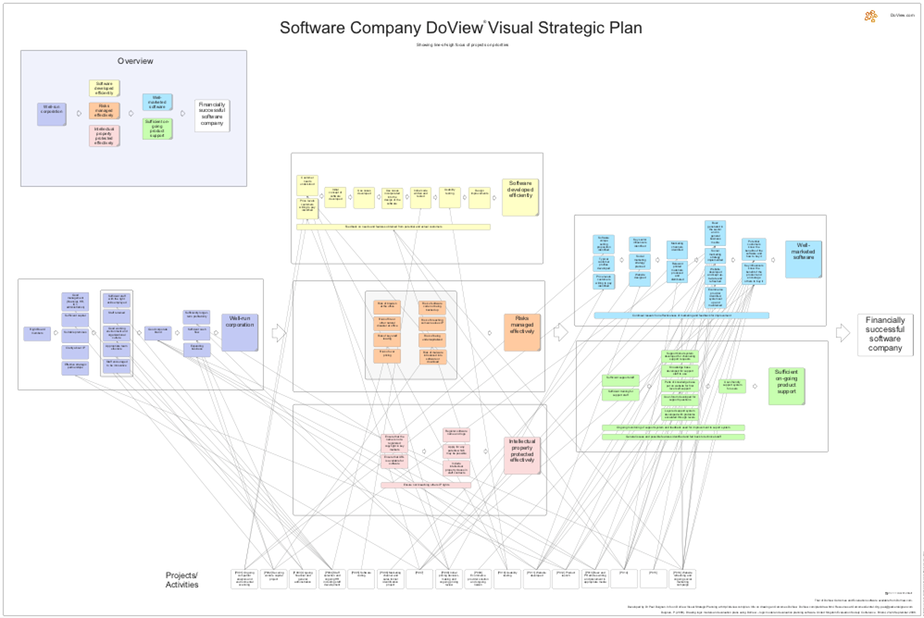
A poster can be used to show how projects have been mapped onto priorities
The second poster below shows that ‘line-of-sight’ mapping has been done. To make the work easier, detailed consideration of whether there is strategic alignment between projects and priorities is done with DoView® software on a page-by-page basis as shown above.
Contact us here.
* OKRs are Outcomes and Key Results as used by Google, Amazon etc.
FC2018